
Figure 2.
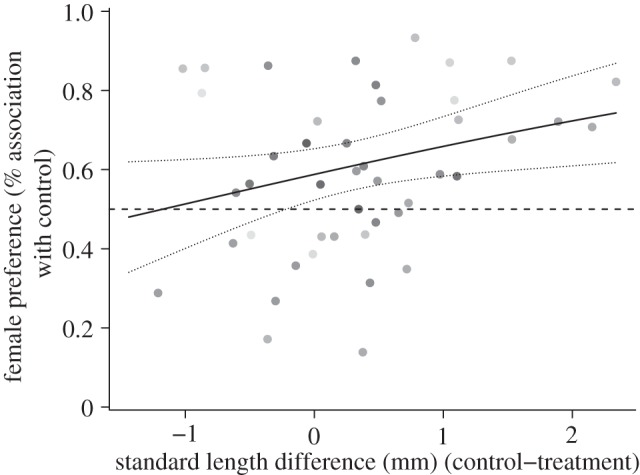
The relationship between the length difference between the control and treatment male and the proportion of time spent with the control male (n = 47). Dot shading is proportional to weighting (i.e. total association time). The solid line shows the fitted model and dotted lines are the 95% CI.