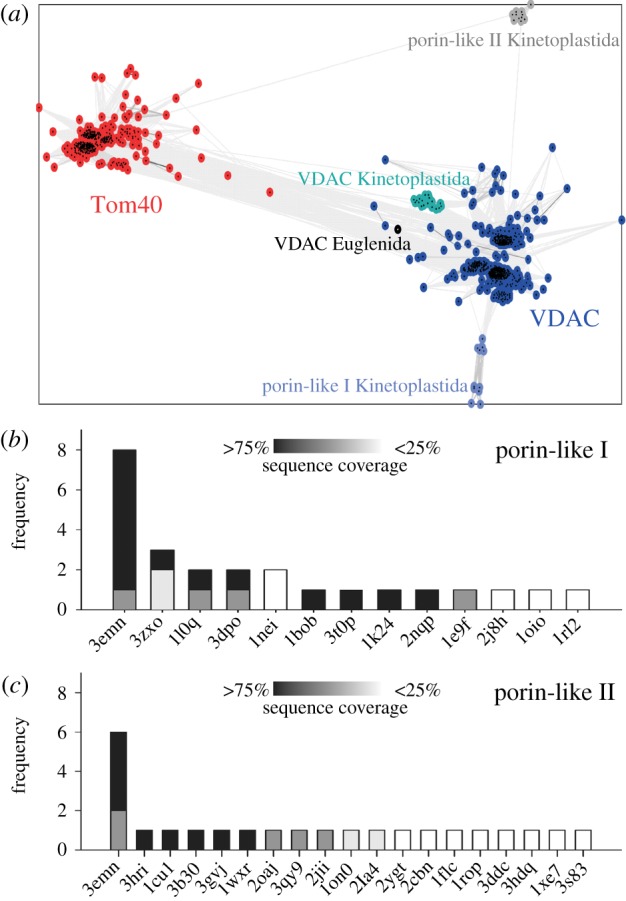
Figure 1.

Classification of eukaryotic porin-like sequences. (a) Sequences of our database were clustered with CLANS by their pairwise similarities (BLAST p-values). Colour indicates cluster membership of sequences. Connections between sequences reflect p-values < 1e−5. (b and c) We have summed up how many times the same fold was detected by nine different fold recognition servers (electronic supplementary material, tables S2 and S3) for (b) Tb11.01.255 and (c) Tb927.4.1610. Sequence coverage of query sequence by the template is indicated by different shades of grey (from black (greater than 75%) to white (less than 25%)).
