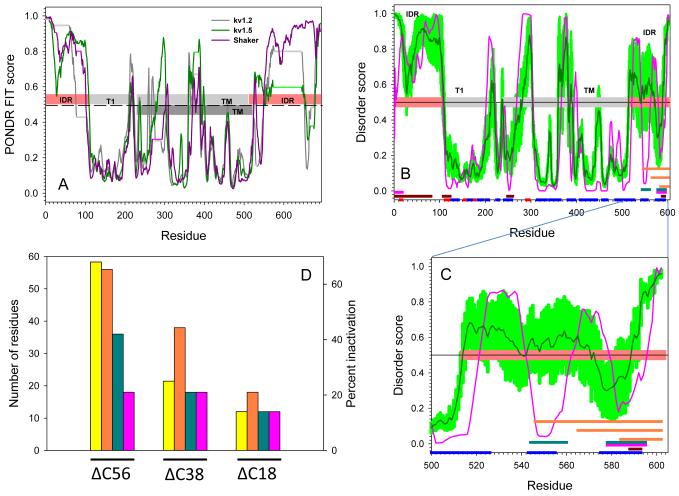
Fig. 9. Evaluation of intrinsic disorder in Kv channels.
(a) Intrinsic disorder propensities of the rat Kv1.2 (dark gray line), rat Kv1.5 (dark green line), and Drosophila Shaker channel (dark pink line). In each protein, per residue disorder propensity was evaluated by PONDR® FIT algorithm. Results are shown for sequences aligned by ClustALW. All residues with disorder score higher than 0.5 (above dashed line) are predicted to be disordered; while residues with disorder score lower than 0.5 (below dashed line) are expected to be structured. Horizontal light gray, light green and light pink lines correspond to the gaps in the sequence alignment between Kv1.2, Kv1.5, and Drosophila Shaker, respectively. Light pink and gray bars in the middle of the plot show localization of the structured domain and disordered regions for Shaker Kv1.2 (PDB id: 3LUT). IDR stands for Intrinsically Disordered Region; T1 is T1 domain; TM refers to the TransMembrane domain. The transmembrane domain of Kv1.5 has been annotated as dark gray bar. Panel (b) shows the Disorder analysis and functionally important sequence features of the Kv1.5 channel. Results of the disorder prediction by PONDR® VLXT and PONDR® FIT are shown by pink and dark green lines, respectively. Light green shadow covers the distribution of errors in evaluation of disorder scores by PONDR® FIT. Three parallel orange bars at the C-terminal are locations of the three segments in deletion mutagenesis experiments. The red and blue bars at the bottom of the plot illustrate the localization of the Jpred-predicted β-strands and α-helices, respectively. Locations of the predicted α-MoRFs, AIBS, and potential VLXT-based binding sites are shown by pink, dark red and dark cyan bars, respectively. Panel (c) is an inset to Panel (b) which represents the extended view for the residue range 500-602 of the disorder distribution and functionally important sequence features in the C-terminal domain of the Kv1.5 channel. Annotations are the same as in (b). (d) Comparison of the % inactivation (yellow bars) with the length of the deleted C-terminal regions (orange bars) and the length of the deleted potential binding regions, MoRFs (pink bars) and VLXT-based binding sites (dark green bars).

