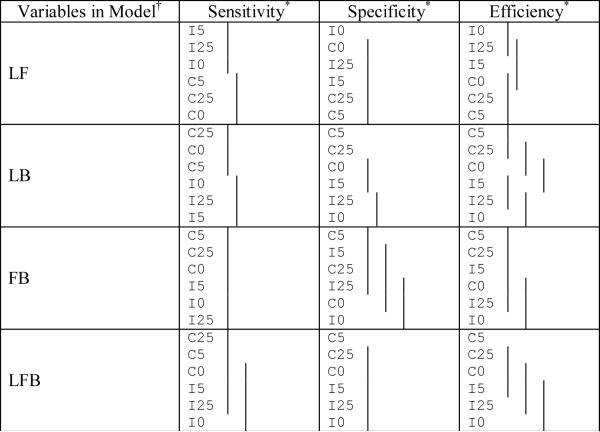
Table 9a.
Comparison of the sensitivity, specificity, and efficiency among the different random model structures for the different variable combinations used in the classification (means covered by the same solid line are not significantly different using the Tukey multiple comparisons procedure). The cutoff used is 0.5.
 |
L, F, and B represent LPSA, FTI, and BMI respectively (no significant differences exist for individual variables).
Notation used is I = independent random effects across variables, C = correlated random effects across variables; 0 represents the error correlation of 0, 25 represents the error correlation of 0.25, and 5 represents the error correlation of 0.5.
