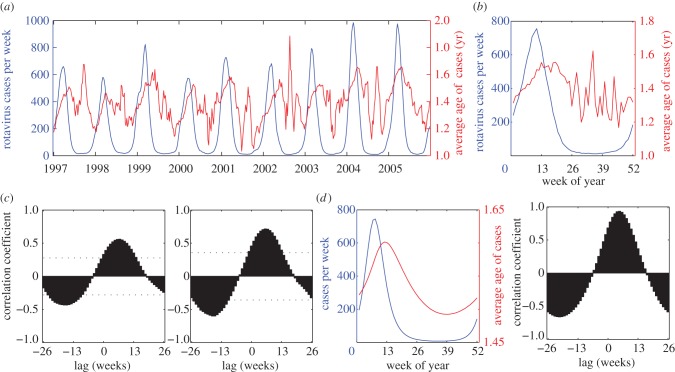
Figure 2.
Relationship between the average age and incidence of rotavirus hospitalizations in the United States. (a) The number of weekly rotavirus hospitalizations (blue) among children less than 5 years of age in 16 US states from 1997 to 2005, and the average age of rotavirus patients (red). We smoothed the data using a five week moving average. (b) Mean number and average age of rotavirus cases by week of the year. (c) Correlation coefficients between the number of hospitalizations at time t and the average age of patients at time t + l for the longitudinal analysis and aggregate analysis. The dotted lines represent the range within which 95% of the maximum and minimum correlations fell when we randomly permuted the average age time series. (d) Model-predicted relationship between the number and average age of rotavirus cases assuming an SIRS-like structure for a best-fit model [17].

