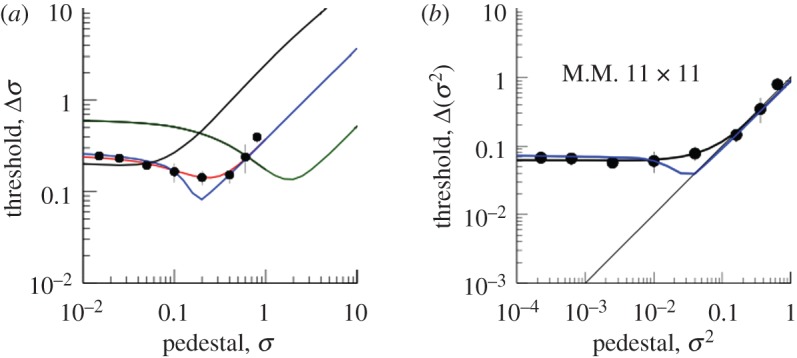
Figure 3.

The results (filled circles) for observer MM in the 11 × 11 grid condition, and the fits of various models described more fully in the text. (a) The data as a function of the standard deviation of the uniform distribution from which the dot positions were sampled, in units of the canonical dot spacing. The red curve passing through all the data points is the best fit of the undersampling model, with six dots per sample. The blue curve is a fit of the sensory threshold model with the threshold constrained to be the same as the variance of the internal noise. The green curve is the best fit of the undersampling model with the number of samples constrained to be the total number of dots (11 × 11). The black curve with no dip is the fit of the undersampling model with n = 2. (b) Thresholds (σ2) as a function of pedestal (σ2). The black curve is the best fit of the undersampling model. The blue curve is a fit of the sensory threshold model with the threshold constrained to be the same as the variance of the internal noise.
