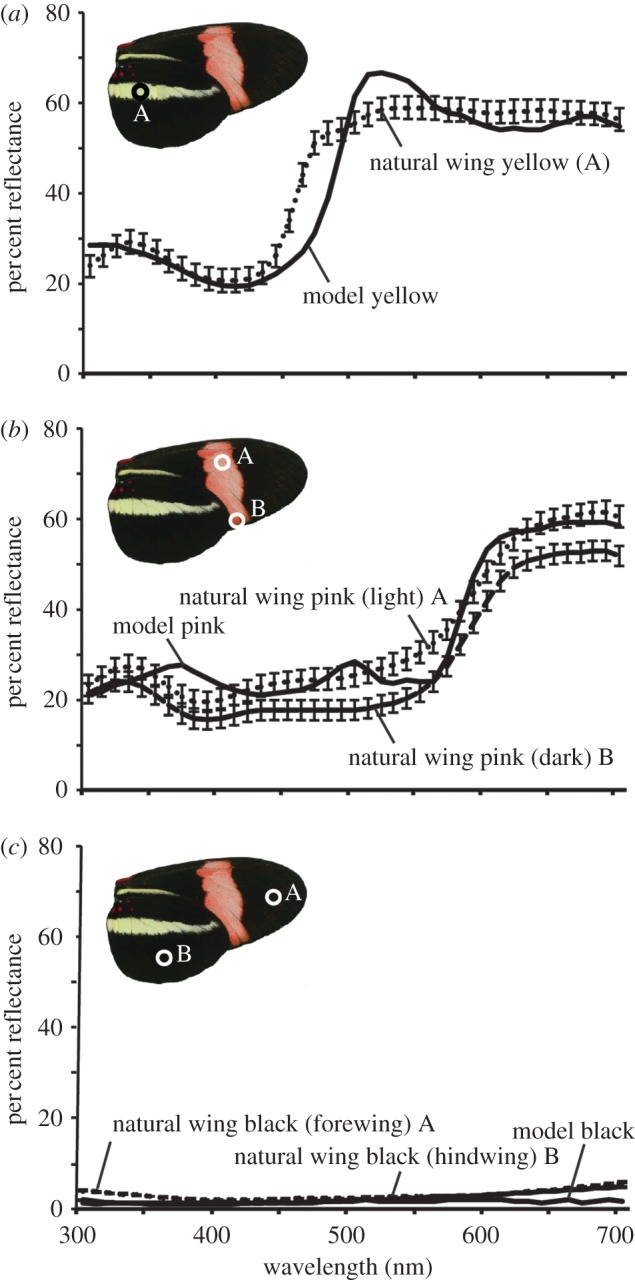
Figure 2.

Reflectance spectra of natural and artificial butterfly wings used in discriminability calculations. Shown are the mean values and standard errors (each n = 12). Graphs include a ventral image of Heliconius erato petiverana with circled regions indicating where wing reflectance measurements were taken. (a) Yellow reflectance spectra. (b) Pink reflectance spectra, comparisons made using lightest A and darkest B pink regions on the wing. (c) Black reflectance spectra, comparisons made using both forewing A and hindwing B regions.
