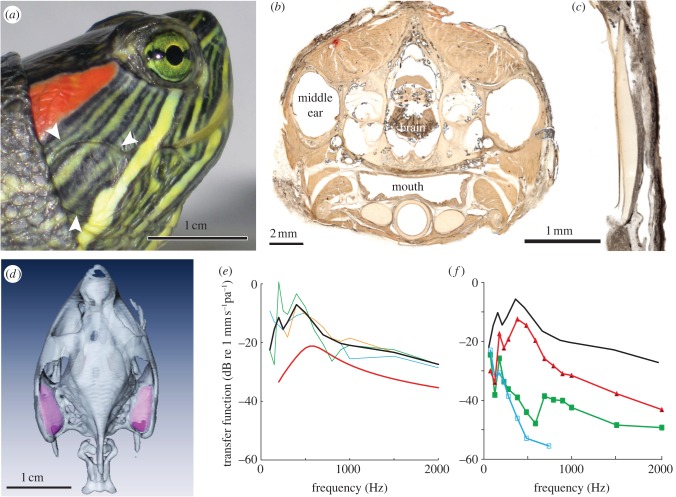
Figure 1.
Ear structure and laser vibrometry. (a) The turtle ear is characterized by a covering of relatively undifferentiated skin (arrows). Scale bar, 1 cm. (b) Transverse thick (200 µm) section through a decalcified head embedded in celloidin at the level of the middle ear (ear). Scale bar, 2 mm. (c) The extracolumella forms a cartilaginous tympanic disc, shown here with overlying epidermis. Scale bar, 1 mm. (d) CT Scan of the turtle skull, with middle ear cavities shown in purple. The volume of the cavities measured from the scans is approximately 0.5 ml. Scale bar, 1 cm. (e) Laser measurement of disc vibration stimulated by underwater sound for three animals. Y-axis, eardrum vibration transfer functions; eardrum vibration velocities scaled by the sound pressure measured at the tympanic disc. Maximal disc vibrations are seen at 500–800 Hz, where disc vibrations are approximately 0.3 mm s−1 Pa−1. The red line shows model data of fish swimbladder vibrations in a sound field [19] for 0.5 ml volume. (f) Eardrum vibration transfer function before (black, median) and after filling the middle ear cavity with water (red). Also shown are vibration transfer functions of an adjacent region of the head (green) and particle velocity (blue).

