
Figure 2.
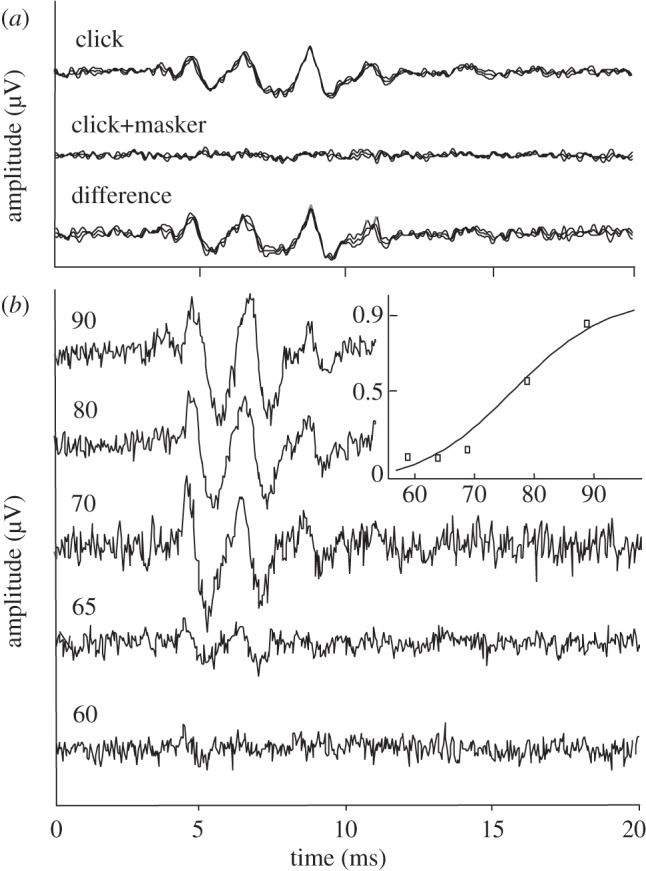
Generation and measurement of the masked ABR. (a) Response to click stimulation (upper trace), masked click stimulation (middle trace) and difference (bottom trace). (b) The ABR difference signal (as measured in A) at five different masker amplitudes (increasing from bottom to top). Insert: average amplitude of the difference signal (normalized by click response) as a function of masker level (symbols). A sigmoid function is fitted to the data (curve). Response thresholds are calculated from such curves as the levels where the response exceeds the average noise level in the recording.