
Figure 5.
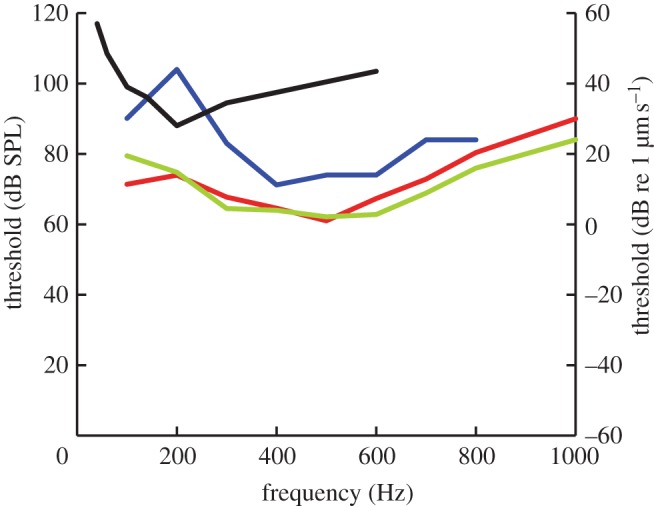
Summary. Audiograms (median values) from figures 3 and 4 for comparison. Note that the vibrograms are plotted relative to the right axis as vibration velocities (dB re 1 µm s−1), while both airborne and underwater sound thresholds are plotted relative to the left axis in dB SPL (i.e. re 20 µPa, r.m.s.). Red line, sound–air; blue line, sound–water; black line, body vibration; green line, tympanic disc vibration.