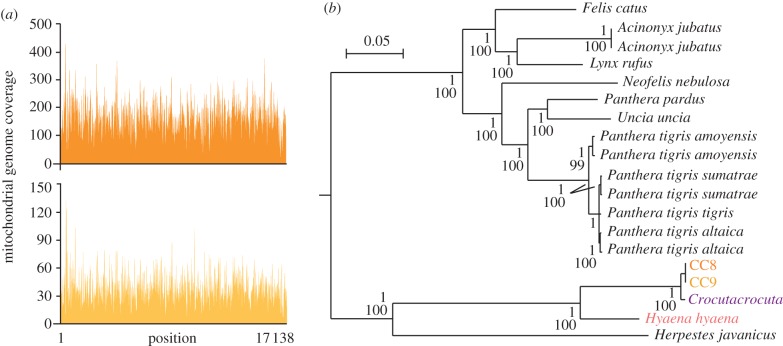
Figure 2.
Cave hyena mitochondrial genome. (a) Number of reads for each position of the cave hyena mitochondrial genome for CC8 (top) and CC9 (bottom) coprolites. (b) Phylogenetic analysis of the cave hyena with complete mitochondrial genome sequences. Tree construction was performed by Bayesian phylogenetic inference using Caniformia sequences as an outgroup. The posterior probability and bootstrap values that support the nodes are indicated for Bayesian phylogenetic inference and maximum-likelihood analysis, respectively. Coloured characters indicate mitochondrial genomes provided by this study. The scale indicates the genetic distance.

