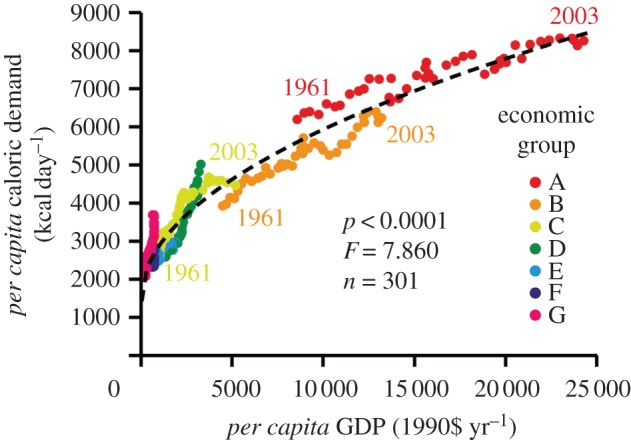
Figure 1.

The relationship between per capita demand for crop calories and per capita gross domestic product (GDP) from 1961 to 2003, for groups of countries ordered from richest (A) to poorest (G). The curve is fitted to the square root of per capita GDP. From Tilman et al. [14].
