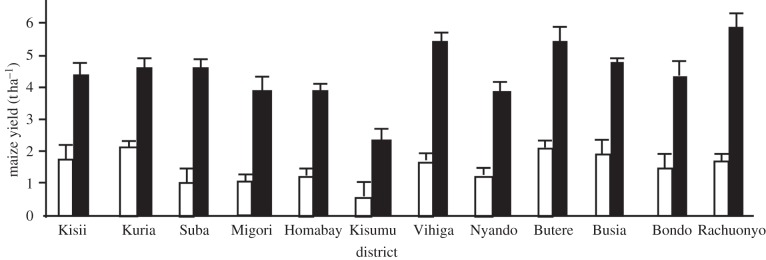
Figure 4.
Mean (±s.e.) maize yield in monocrop plots (open bars) and push–pull plots (filled bars) in different districts of western Kenya. Means are from 30 fields and three growing seasons in each district, and in every district differ between monocrop and push–pull plots at p < 0.0001. From Khan et al. [82].

