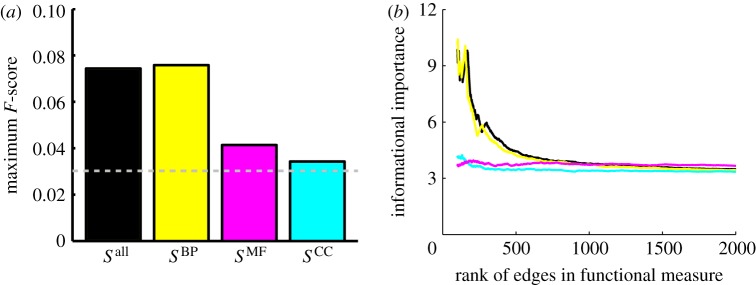
Figure 6.
The predictive power of each individual ontology and their contribution to the informational importance of the regulatory edges. (a) Comparison of the predictive power of each individual ontology, estimated by calculating the maximum F-score, based on the scaled similarity components originating from each of the three ontologies. (b) A plot of the informational importance of edges in RegulonDB, ordered by the scaled similarity values as calculated using each individual ontology. Black denotes all annotations; yellow, Biological Process; magenta, Molecular Function; cyan, Cellular Component.

