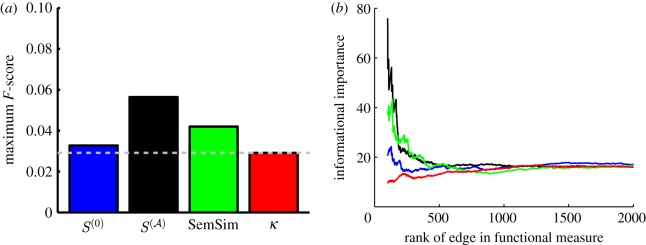
Figure 7.
The predictive power of functional similarity measures and their relationship to the informational importance of the edges in the yeast regulatory network. (a) Comparison of the predictive power of the functional similarity measures in yeast, estimated by calculating the maximum F-score. (b) A plot of the informational importance of edges in the yeast regulatory network, ordered by the functional similarity values estimated by each measure. Blue denotes scaled similarity  black, scaled similarity (high α); green, semantic similarity; red, Kappa statistic.

