
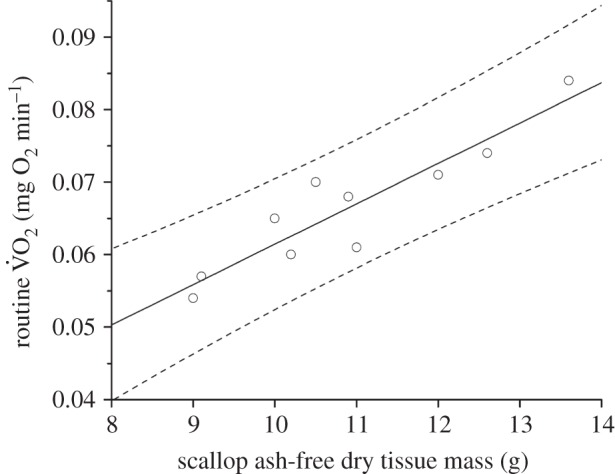
Figure 3.
Routine metabolic rate (measured as rate of oxygen consumption,  ; mg O2 min−1) against hatchery scallop ash-free dry tissue mass (g). The best-fit regression line (solid line) and 95% prediction intervals (dashed lines) are shown.
Official websites use .gov
A
.gov website belongs to an official
government organization in the United States.
Secure .gov websites use HTTPS
A lock (
) or https:// means you've safely
connected to the .gov website. Share sensitive
information only on official, secure websites.
Routine metabolic rate (measured as rate of oxygen consumption, ; mg O2 min−1) against hatchery scallop ash-free dry tissue mass (g). The best-fit regression line (solid line) and 95% prediction intervals (dashed lines) are shown.