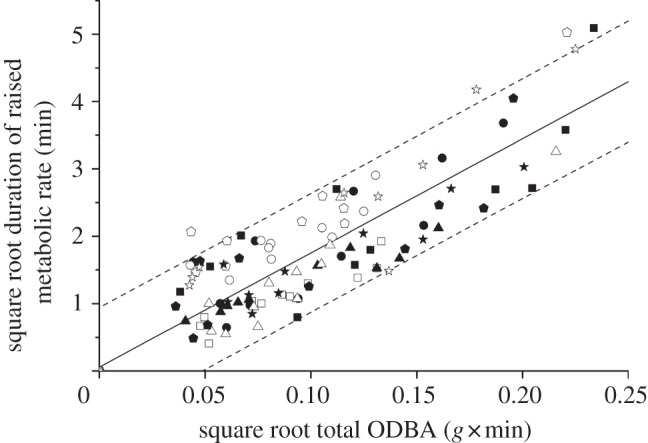
Figure 5.

Square root of the duration of raised metabolic rate (min) associated with movement against the square root of total ODBA (mean ODBA for a movement × duration of movement) during the movement for each hatchery scallop (denoted by different symbols) during a range of movements. The best-fit regression line (solid line) and 95% prediction intervals (dashed lines) are shown.
