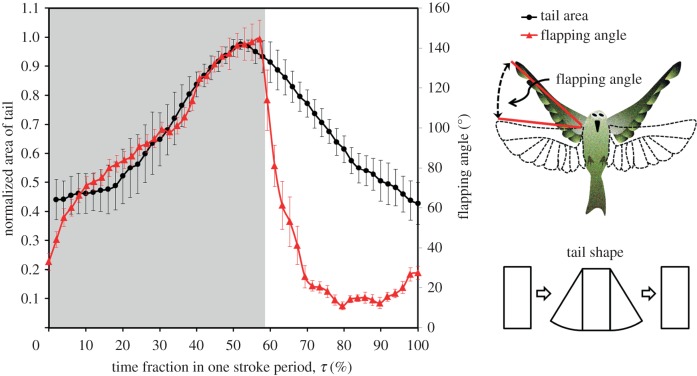
Figure 6.
Variation of the normalized tail area and flapping angle within one hovering wingbeat cycle. The right side presents schematic of the definition of the flapping angle and varied tail shapes. The error bars indicate s.d. (n = 8). The zone shaded grey corresponds to the period of a downstroke.

