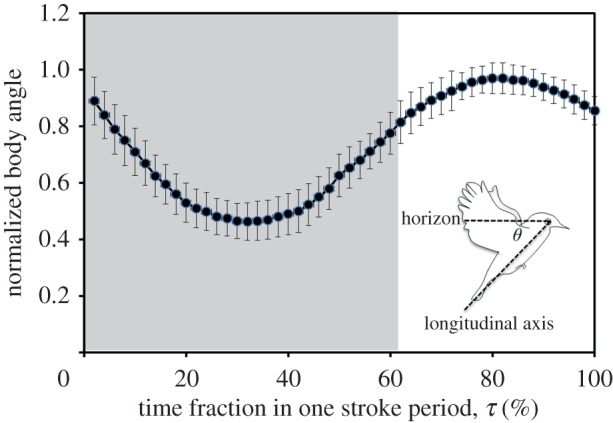
Figure 8.

Variation of normalized body angle θ within a hovering wingbeat cycle. The inset illustrates how this angle is defined. Values are mean ± s.d. (n = 8). The zone shaded grey corresponds to the period of a downstroke. (Online version in colour.)
