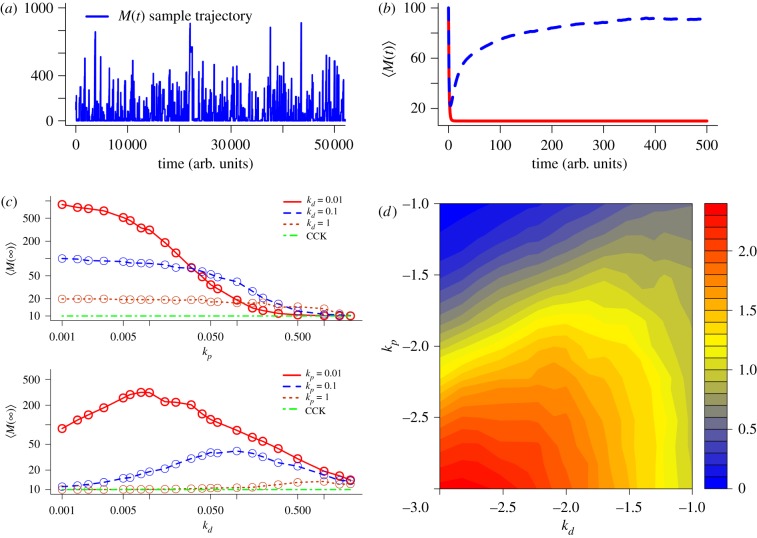
Figure 2.
Comparison of the behaviour of M(t) between the classical chemical kinetics (CCK) model and the stochastic chemical kinetics (SCK) model of the simplified gene expression reactions. (a) A sample trajectory of M(t) from the SCK model. (b) Comparison between M(t) of the CCK model (red solid line) and 〈M(t)〉 of the SCK model (blue dashed line). (c) Stationary mean of M with respect to various combinations of kp and kd. The circles represent the data points sampled via simulations. (d) Log–log heat map to show the ratio of M∞ to ME for various combinations of kp and kd. The numbers shown in the x- and y-axis are kd and kp in log scale (base 10), respectively. The ratio in the z-axis is given by log10 (M∞/ME). The values of the parameters used in this numerical analysis are k1 = 10, k2 = 1 and M(0) = 100. In the simulation of (a) and (b), the values of kd and kp are set to 0.1 and 0.01, respectively.

