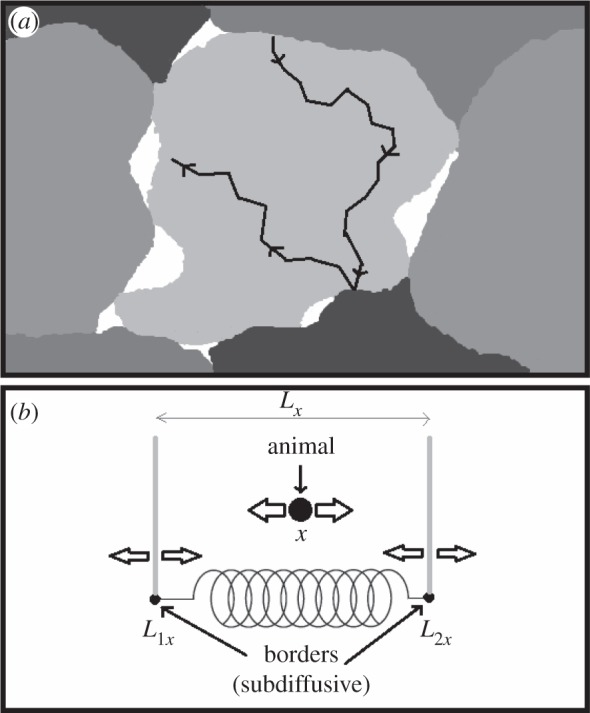
Figure 1.

(a) Pictorial representation of the territorial random walk model, and (b) its mean-field approximation. (a) Each shade denotes the area where a particular animal has deposited fresh scent (its territory). The white areas are interstitial regions, where there is no fresh scent from any animal. Territory borders move when an animal travels into the interstitial region and leaves scent cues, thus claiming the region for its own territory. A territory's size will tend to fluctuate around an average value equal to the inverse of the population density. The black line denotes a possible path of an animal inhabiting the light grey territory. Panel (b) shows a schematic of the reduced analytical model, displayed in one dimension for diagrammatic simplicity. The borders move randomly and subdiffusively, but are joined together by a spring whose rest distance is the average territory width. In two dimensions, the average territory size corresponds to a rest ‘area’ enclosed by two springs along two orthogonal axes, whose dimension is the inverse of the population density. For circular geometry, the territory radius fluctuates around a rest distance that encloses an area whose dimension is the inverse of the population density. The parameters controlling the animal movement vary between the ballistic and the Brownian limit. In between those two extremes, an animal moves with some degree of persistence, e.g. as a correlated random walker.
