Figure 15.

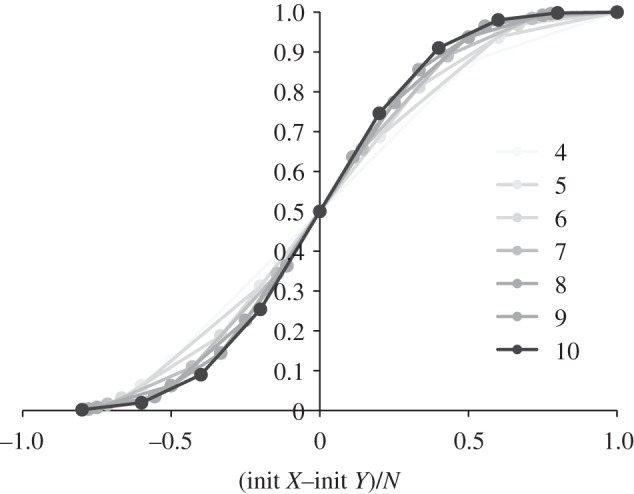
Probability of reaching a consensus of X, plotted against (X0 − Y0 )/N, which is the difference between the initial populations of X and Y, relative to the total initial population N = X0 + Y0 . Results are shown for N = 4 … 10.

Probability of reaching a consensus of X, plotted against (X0 − Y0 )/N, which is the difference between the initial populations of X and Y, relative to the total initial population N = X0 + Y0 . Results are shown for N = 4 … 10.