Figure 6.

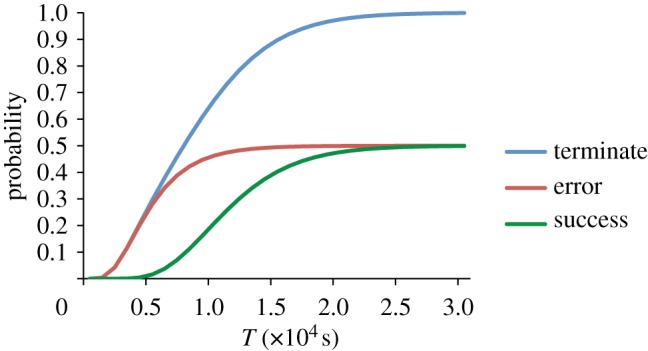
Plot showing the probability for each possible outcome of the faulty transducer pair, after T seconds. (Online version in colour.)

Plot showing the probability for each possible outcome of the faulty transducer pair, after T seconds. (Online version in colour.)