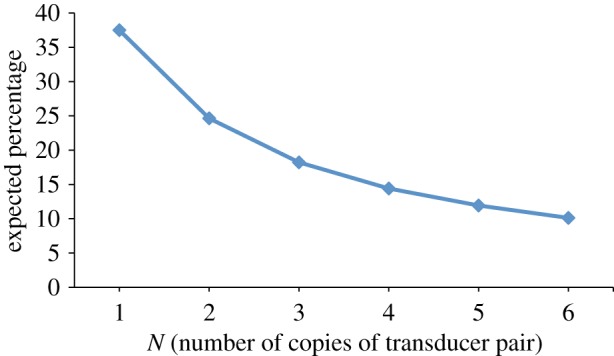
Figure 7.

Plot showing expected percentage of leftover reactive gates in the final state of the system against the number of parallel buggy transducers—that is, the parameter N in the system S(N,x0)| T(N,x0,x1)| T(N,x1,x2). We observe that the expected number of unreactive (i.e. correctly executed) gates increases as we add more parallel copies of the buggy transducer system. (Online version in colour.)
