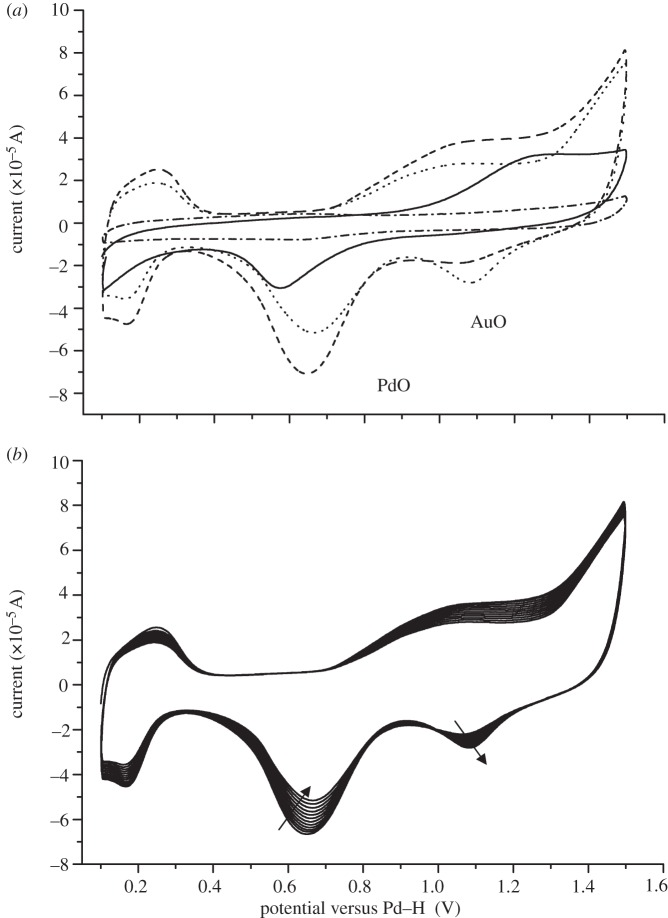
Figure 2.
Surface analysis of bioPd–Au using cyclic voltammetry (CV). (a) Voltammetric profile of bioPd–Au in 0.1 M H2SO4 for the first cycle (solid line), the tenth cycle (dashed line), the last cycle (dotted line) and the glassy carbon support (dash-dotted line). Scan rate 100 mV s−1. (b) Voltammetric profile of bioPd–Au in 0.1 M H2SO4 from scan 10 onwards. The arrows show the increase/decrease of oxide peaks. Scan rate 100 mV s−1.

