Fig. 1.
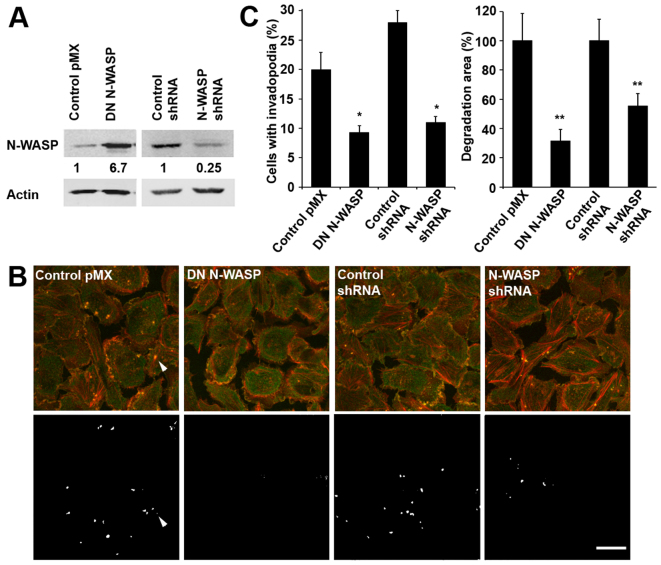
Establishment of MTLn3 cell lines expressing DN N-WASP and shRNA constructs and effects on invadopodium formation and activity. (A) Relative expression levels of N-WASP protein measured in lysates of control MTLn3 (pMX and scrambled shRNA) cells or MTLn3 cells stably overexpressing DN N-WASP or N-WASP shRNA. Immunoblotting was done with anti-N-WASP or anti-β-actin antibodies. (B) Representative images of MTLn3 control (pMX and scrambled shRNA) cells and cells expressing DN N-WASP or N-WASP shRNA cultured on a fluorescent gelatin-based matrix. Fixed cells were labeled for anti-cortactin (green) and actin (phalloidin, red). Upper panels show invadopodia (anti-cortactin and phalloidin colocalization – yellow inside cells); lower panels show sites of degraded gelatin substrate (white). Scale bar: 20 μm. The arrowhead points to an invadopodium and its corresponding hole in the matrix. (C) The number of cells with invadopodia (dots where cortactin and actin are colocalized) and the percentage of degraded matrix were calculated in control, DN -N-WASP and N-WASP shRNA cell lines. Error bars indicate the s.e.m. of three separate experiments. In each determination, ≥20 different fields of view with ≥100 cells were analyzed; error bars indicate the s.e.m.; *P<0.05, **P<0.01, Student's t-test.

