Fig. 5.
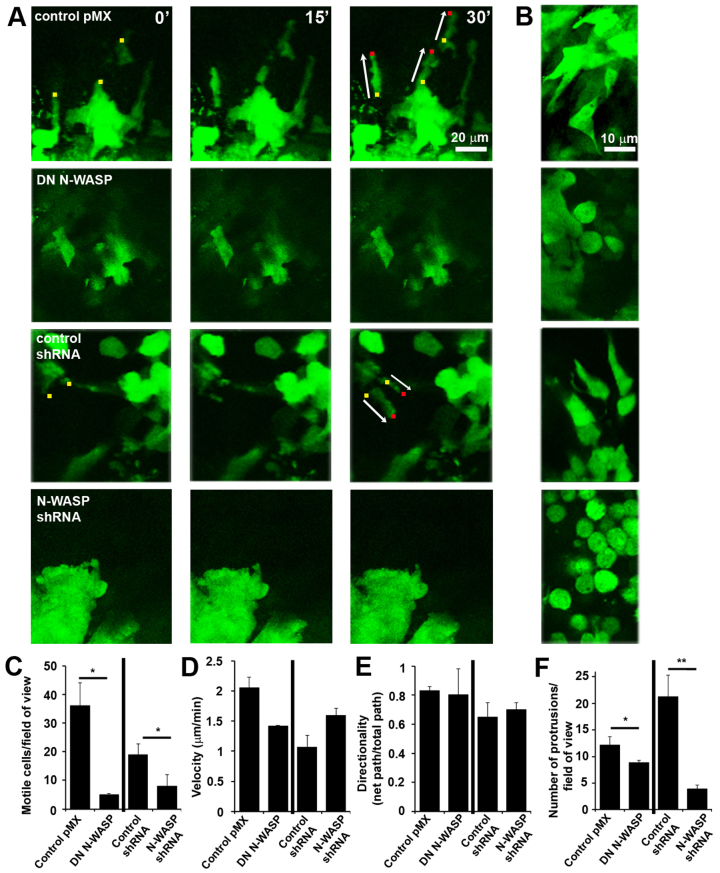
Cell motility and protrusion formation in vivo requires N-WASP. (A) Motility of control and N-WASP-deficient GFP-labeled cells was monitored over time at different regions of the tumor using time-lapse images taken at 0, 15 and 30 minutes (images at same z-sections are shown). Small colored squares indicate the cell fronts (yellow at 0 minutes, red at 30 minutes) and arrows show the length of the trajectory of the migrating cells. (B) Higher magnifications of regions where cells are sparsely distributed showing that more protrusions are present in control tumors. (C–F) Data from both control and N-WASP-deficient tumors showing the number of motile cells per 4D stack (C), velocity of motile cells (D), directionality of motile cells (E) and number of protrusions per 4D stack (F). *P<0.05, **P<0.01, Student's t-test, from three or more different tumors. The 4D stacks were 512×512×100 μm×30 minutes; n=30.

