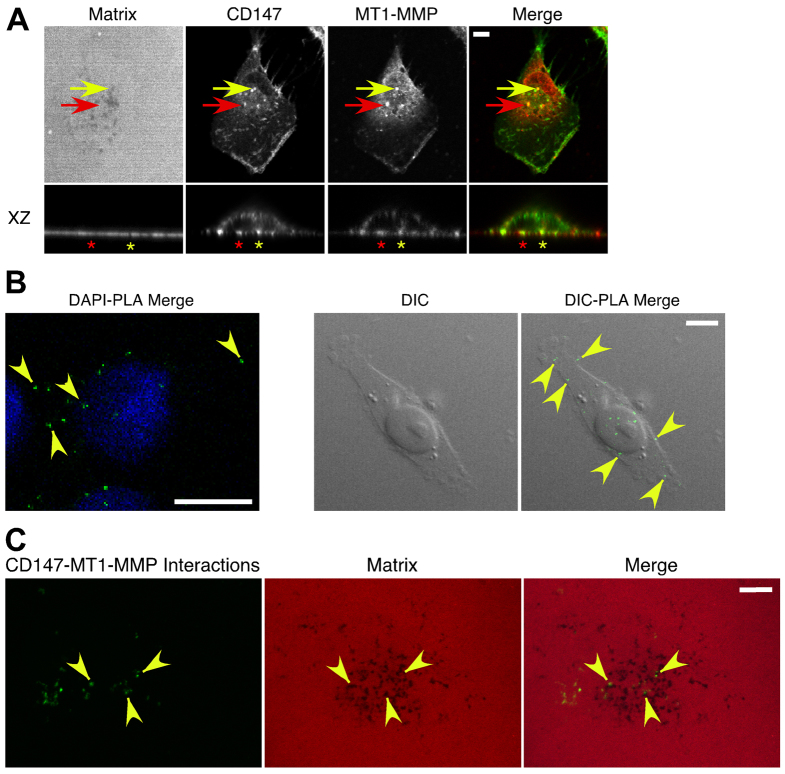
Fig. 8.
Colocalization of CD147 and MT1-MMP in invasive breast cancer cells. (A) Representative images demonstrating CD147 and MT1-MMP colocalization in MDA-MB-231 cells. Cells were cultured on Alexa-Fluor-568-conjugated gelatin for 5 hours and probed with Alexa-Fluor-488-conjugated CD147 and MT1-MMP followed by an Alexa-Fluor-647 secondary antibody. A polyclonal antibody against MT1-MMP was used for these images; a monoclonal antibody against MT1-MMP gave similar results (supplementary material Fig. S2). MT1-MMP and the gelatin matrix were pseudo-colored red and blue, respectively; this allowed easier visualization of colocalization (yellow) of CD147 (green) and MT1-MMP (red). Yellow arrow indicates colocalization of CD147 and MT1-MMP over foci of degraded matrix; red arrow indicates colocalization of CD147 and MT1-MMP over an area not showing degraded matrix. XZ section: yellow asterisk, CD147–MT1-MMP colocalization over a region of degraded matrix; red asterisk, CD147–MT1-MMP colocalization over an area not showing matrix degradation. n=3. (B,C) A proximity ligation assay (PLA) was employed to detect close protein–protein interactions (≤40 nm) of CD147 and MT1-MMP in MDA-MB-231 cells (see Materials and Methods for details). (B) Left panel: interactions of CD147 and MT1-MMP (small green dots at arrowheads); cells were also stained with DAPI (blue). Right panel: DIC images of a single cell; arrowheads indicate sites of CD147–MT1-MMP interactions, which are restricted to areas over the cell. (C) PLA combined with gelatin degradation assay, showing that CD147–MT1-MMP interactions occurred over areas of degradation (arrowheads), as well as over areas lacking degradation. Scale bars: 10 μm.

