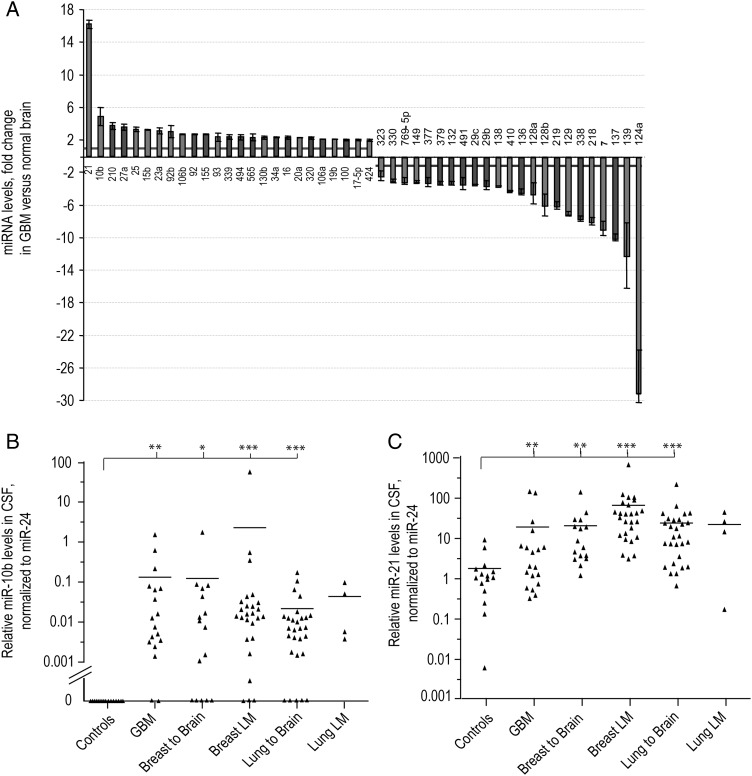
Fig. 1.
MiR-10b and miR-21 upregulation in GBM and their CSF levels in patients with GBM or metastatic brain cancer and nonneoplastic controls. (A) MiRNAs were deregulated in GBM more than 2-fold compared with normal brains. MiRNA levels were obtained by the analysis of TCGA miRNA microarray data; error bars represent standard deviation between individual probe sets present for each miRNA on the arrays. (B) MiR-10b and (C) miR-21 levels were examined by qRT-PCR in CSF samples of neurological patients. Relative levels were normalized to miR-24, as described in Materials and Methods and demonstrated for individual CSF samples. Horizontal lines indicate arithmetic mean of miRNA levels for each group of patients: “Controls” = nonneoplastic neuropathologic cases, “GBM” = glioblastoma cases, “Breast to Brain” and “Lung to Brain” = breast and lung cancer brain metastasis, “Breast LM” and “Lung LM” = breast and lung cancer leptomeningeal metastasis, respectively. Differences between group means have been determined by nonparametric Wilcoxon signed rank test, and the significance is indicated by asterisks: *P < .05, **P < .001, ***P < .0001. MiR-10b and miR-21 CSF levels normalized to miR-125b are presented in Supplementary Fig. S2A and S2B.

