Fig. 3.
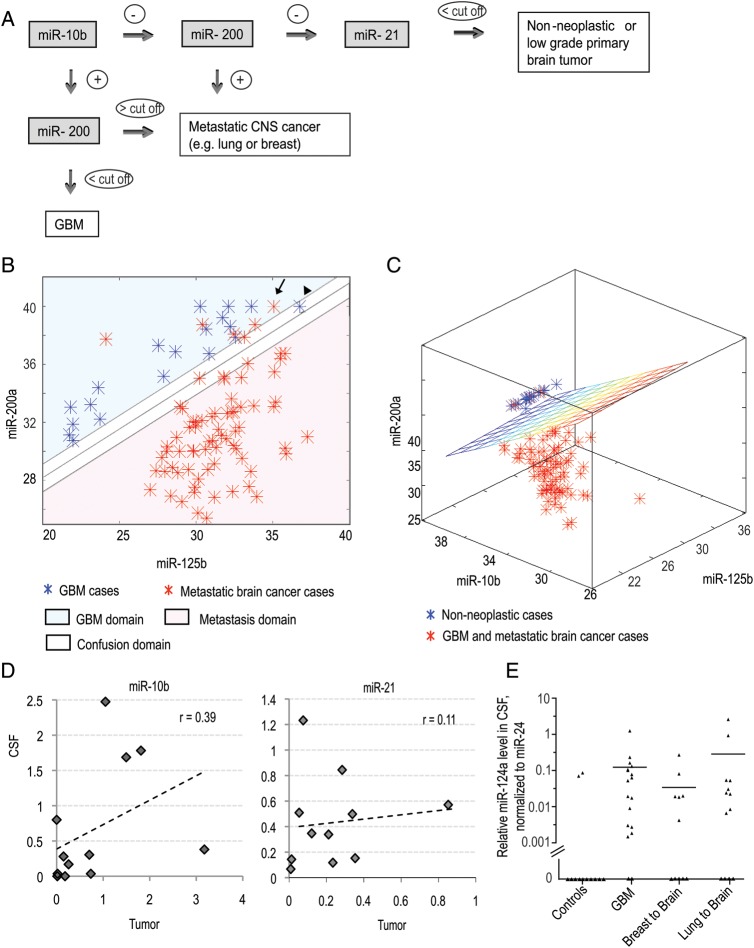
Computational classification of high-grade brain malignancies based on CSF miRNA profiling and the origin of miRNA in CSF. (A) Classification tree of brain cancer patients based on CSF miRNA biomarkers (miR-10b, -21, and -200). (B and C) Application of SVM with linear kernel to classification of specimens: (B) classification of GBM vs metastatic brain cancer on the basis of Ct levels of 2 miRNAs (miR-200a and miR-125b) in the CSF. The Ct values of corresponding miRNAs are plotted. A specimen is classified as GBM/metastasis depending on whether the Ct levels of the 2 miRNAs place it above/below the separation line. The line illustrates the automatically generated classifier. The arrow depicts a misclassified sample and the arrowhead depicts a “confused” sample. (C) Classification of GBM and brain metastasis versus nonneoplastic control cases on the basis of Ct levels of 3 miRNAs (miR-10b, miR-200a, and miR-125b) in the CSF. A specimen is classified to a particular group depending on whether its Ct levels place it below/above the separation plane. The plane illustrates the automatically generated classifier. (D) The relation between miR-10b and miR-21 levels in brain tumors and matching CSF samples collected from the same patients. The Pearson coefficients (r) of linear regression between 2 data sets were calculated for each miRNA. (E) Relative miR-124a levels were determined in CSF of a randomly selected cohort of control and brain cancer patients by qRT-PCR analysis. Relative levels were normalized to miR-24, as described in Materials and Methods and demonstrated for individual CSF samples. Horizontal lines indicate arithmetic mean of miRNA levels for each group of patients.

