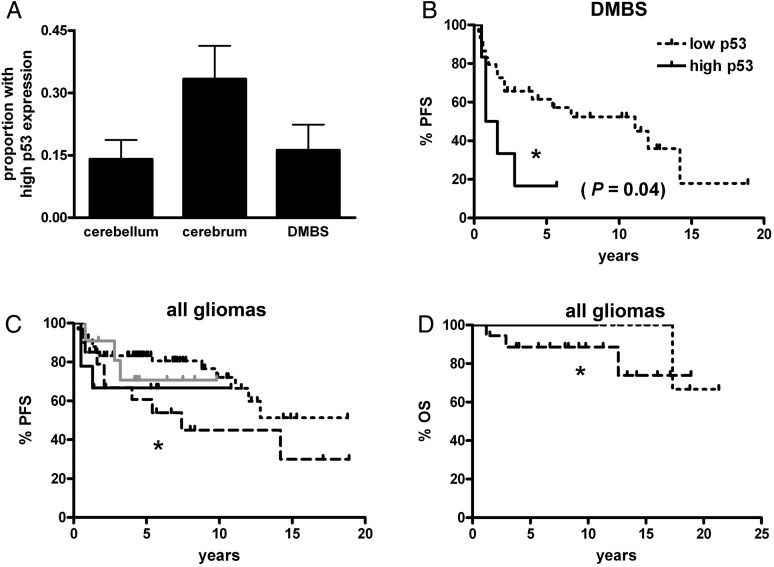
Fig. 5.
PFS and OS in pediatric low-grade gliomas by p53 and BRAF status. (A) There was a strong trend toward the cerebrum having more high-expressing p53 tumors than either cerebellar or DMBS subregions (P = .06), although it was only in the DMBS subregion that high-expressing p53 tumors had shorter PFS (B). (C and D) In all pooled gliomas, those with weak p53 expression and normal BRAF had shorter PFS (C, *P = .05) and OS (D, *P = .02) than weak p53-expressing tumors with any BRAF abnormality (either rearrangement or V600E mutation). However, the degree of p53 expression did not modify PFS or OS when adjusting for BRAF status. Short dotted black line = p53 weak, BRAF abnormal; long dotted black line = p53 weak, BRAF normal; solid grey line = p53 strong, BRAF abnormal; solid black line = p53 strong, BRAF normal. DMBS, diencephalon/midbrain/brainstem/spinal cord.

