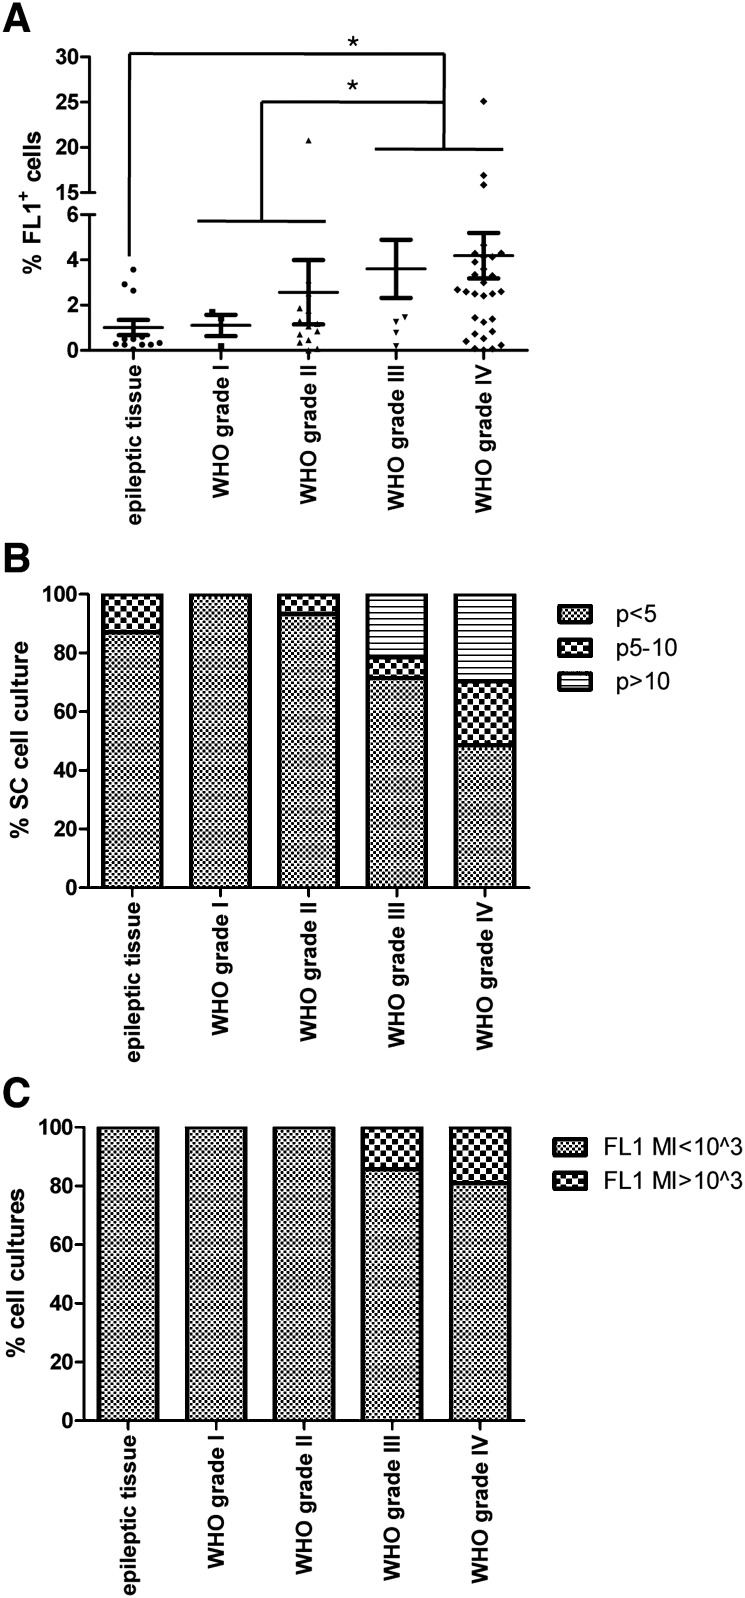
Fig. 2.
Graphs show (A) the percentage of FL1+ cells in various glioma grades compared to nonneoplastic brain, (B) the percentage of long-term cell cultures in various tumor grades and epileptic tissue samples, (C) the intensity of autofluorescence detected at 515 ± 15 nm in the FL1+ cell cultures derived from various tumor grades and epileptic tissues.

