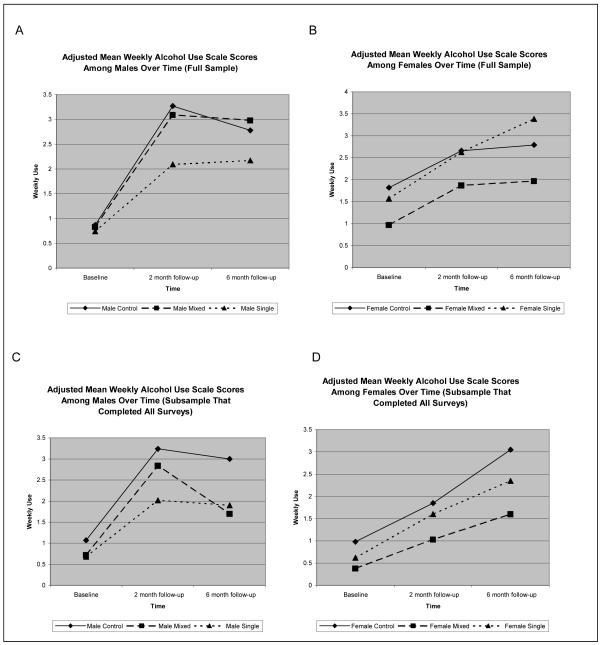
Figure 2.
Exponentiated least squares means of weekly alcohol use scale scores by gender and study condition over time among the full study sample (*N=830) and students completing all study surveys (n=289).
*N=830 refers to the study sample for generalized linear mixed modeling which included all students who completed at least one study survey.
NOTE: The range of individual values for weekly alcohol use is 0 to 35 drinks; the vertical axis only addresses the range of mean values for the study conditions in increments of .5 drinks to highlight differences across conditions.
Clinical/practical significance of these differences must be interpreted cautiously.

