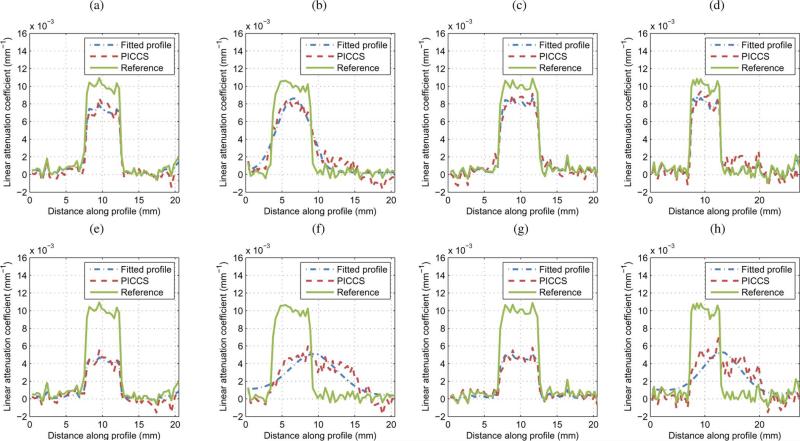
Fig. 5.
Sample profiles through reconstructions. Each plot shows the profile though the reference image and through the PICCS reconstruction with α = 0.5. Also plotted is the profile though the Gaussian blurred reference profile fitted to the PICCS reconstruction profile. The pseudo point spread function (PSF) width and shift were measured from the fitted profile. The line segments used are shown in Figs. 3 and 4.

