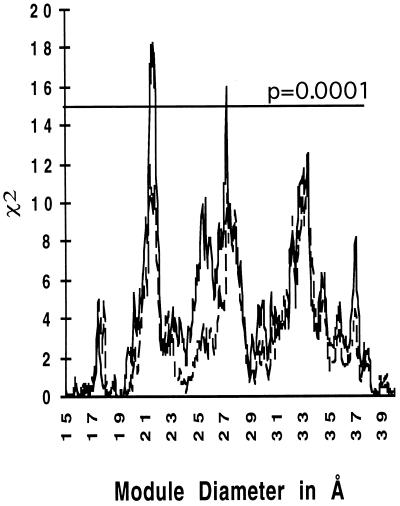
Figure 4.
The same analysis shown in Fig. 2 (dashed line) was repeated using a database of intron positions based on GenBank version 96 (662 intron positions, continuous line). The peaks around 21, 28, and 33 Å now reach χ2 values around 19, 15, and 13, respectively.

