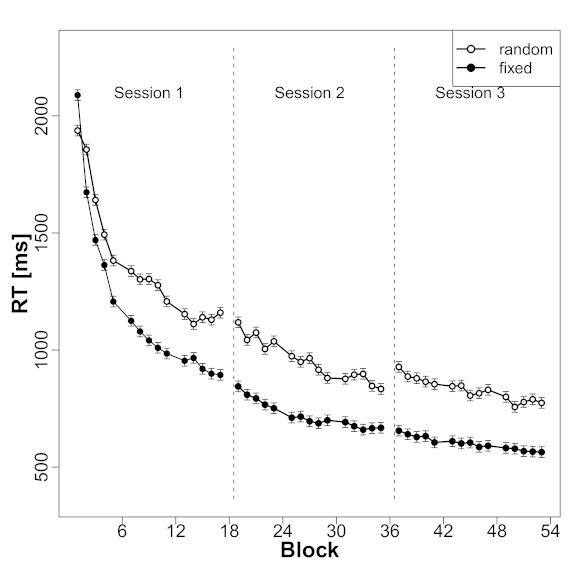
Figure 3.
Development of reaction times (RTs) during the learning phase. The figure shows mean RTs from the fixed sequence (solid circles) and random (empty circles) conditions as a function of block. Vertical dashed lines indicate the beginning/end of a session (about 48 hr without training). Bars indicate standard errors for within-subject designs (based on the interaction effect, see Loftus & Masson, 1994).

