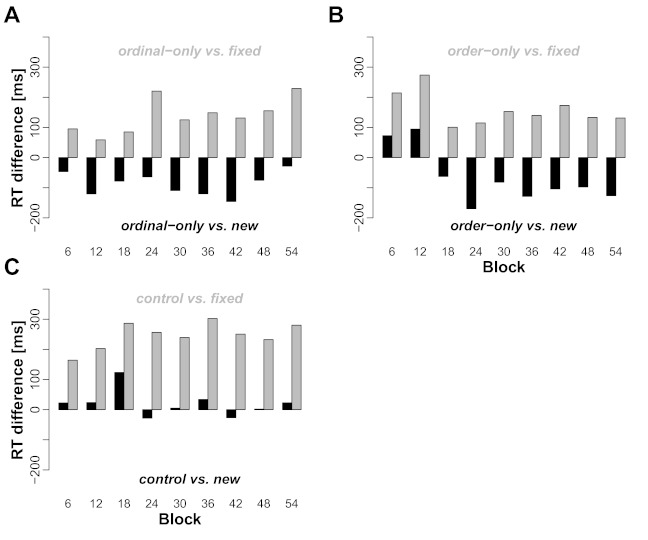
Figure 4.
Reaction times (RTs) in different transfer sequence conditions relative to RTs in fixed sequences and new-location trials. A: For each transfer block, the RTRT difference between test trials in new-transfer sequences (ordinal-only) and fixed sequences (gray bars) and new-location trials (black bars) are shown. Panels B and C also show the two respective differences, where in Panel B order-only trials are taken as reference and in Panel C control trials. For further descriptions, see text.

