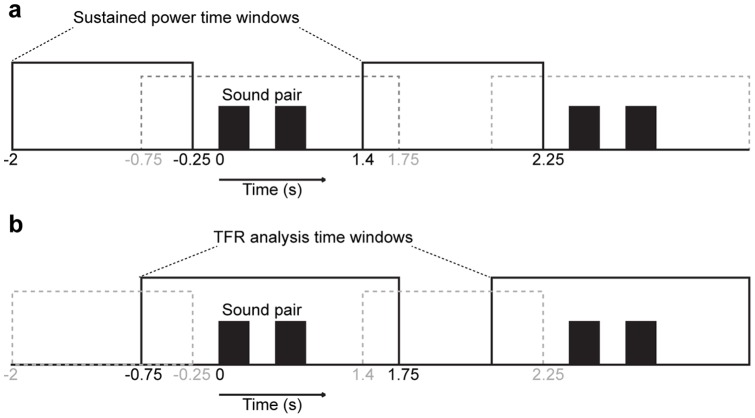
Figure 2. Oscillatory analysis time windows.
(a) Sustained power analysis time window. Spectral analyses of sustained oscillatory activities were conducted in 1.75 s time windows between sound-pair presentations (solid black rectangles). During this time window, activations driven by the stimuli themselves were assumed to be minimal, while the endogenous processes related to the ongoing selective attention task were presumably strongly activated. (b) Analysis window of time-frequency representations (TFR). Dynamic oscillatory power changes were analyzed from a 2.5 s time window overlapping with sound-pair presentations (solid black rectangles). Note that the actual time period for which the power values were obtained is shorter, given the boundary effects in the sliding-window power analysis (e.g., at the lowest frequency of 4 Hz, the effective power time window was −0.38−1.38 s, see Fig. 5 ).

