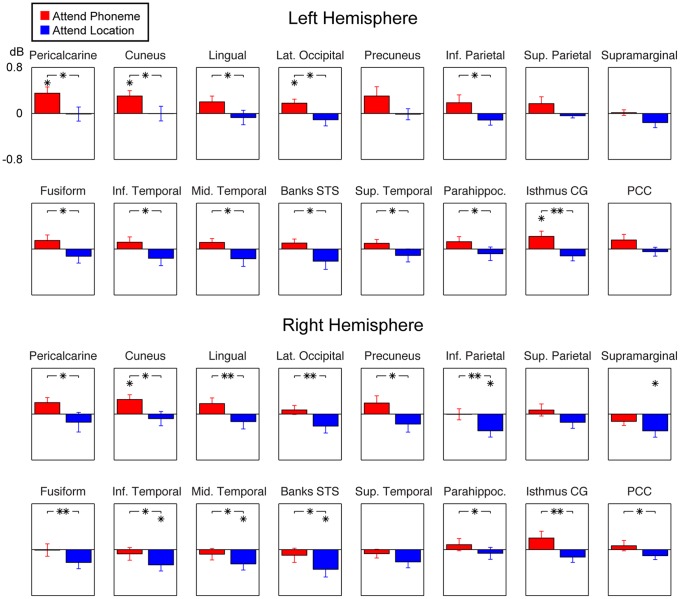
Figure 4. Regions-of-interest (ROI) analyses of alpha activity.
The figure shows 10 × base-10 logarithm normalized ROI alpha power estimates during Attend Phoneme and Attend Location conditions, relative to the Passive condition. Consistent with the whole-cortex mapping analyses shown above, these a priori comparisons of means suggest significant increases of baseline alpha power in several parietal and occipital ROIs during Attend Phoneme vs. Attend Location conditions, indicated by the asterisks with the brackets (*P<0.05, **P<0.01; paired t test). In addition to the main comparisons between the two active conditions, statistical comparisons of the 10 × base-10 logarithm normalized relative power (Attend Phoneme or Attend Location relative to Passive) vs. zero are also shown, to help determine the polarity of attentional modulations relative to the Passive condition, indicated by the asterisk symbols atop each relevant bar (*P<0.05, t test). The normalized amplitude scale is shown in the uppermost left graph.

