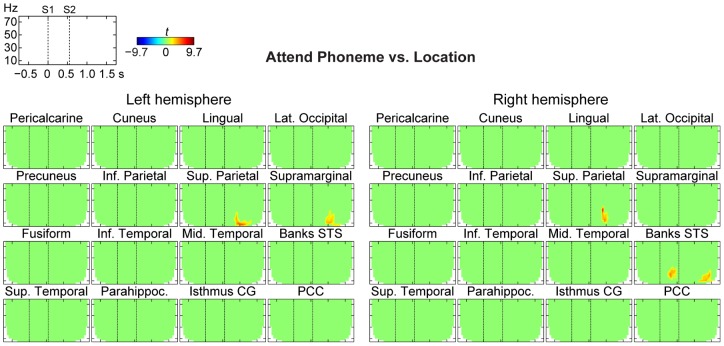
Figure 5. Dynamic time-frequency power analyses of baseline-corrected oscillatory estimates.
The figure shows t values masked to time-frequency bins where the power differences between Attend Phoneme vs. Location conditions were statistically significant (P<0.05, cluster-based randomization test). These analyses, from which the account of sustained power changes reported in Figures 2 and 3 have been removed by pre-stimulus baseline correction, transient power changes centered mainly at the alpha range, but also extended to theta and beta ranges, mainly 400–600 ms after the onset of the second sound in the pair (S2).

