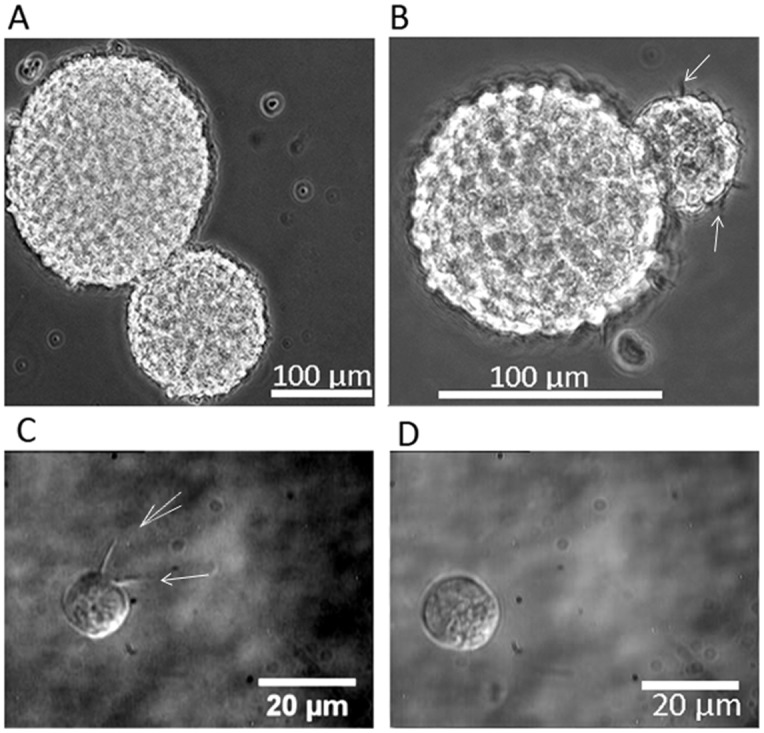
Figure 2. Phase contrast images of neurospheres and single neural progenitor cells from dissociated neurospheres.

A) Two fused neurospheres; B) Fused neurospheres with filopodia visible on the surface; C) Differential interference contrast image of a single neural progenitor cell with filopodia; and D) a single neural progenitor cell without filopodia. Filopodia are indicated by white arrows.
