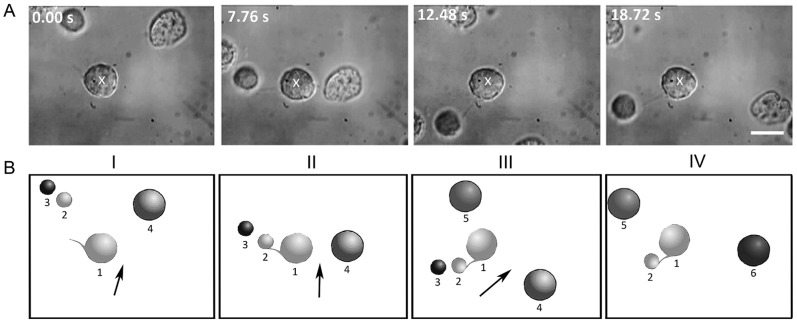
Figure 4. Time lapse images of cell adhesion dynamics.
A) Real-time images and B) corresponding cartoon depictions showing filopodia-mediated adhesion. The white cross in image I denotes the position of the optically-trapped neural progenitor cell 1 that is made to move in the direction indicated by the arrow. Image II shows the filopodia of cell 1 coming into contact with cell 2. Upon moving cell 1 after a period of approximately 5 seconds (Image III), cell 2 also moves along, thereby indicating adhesion of cells 1 and 2, with a filopodial bridge between the two cells. Image IV (6 seconds later) shows that the cells remain adhered. The scale bar denotes 10 µm. See the real-time movie (Movie S1).

