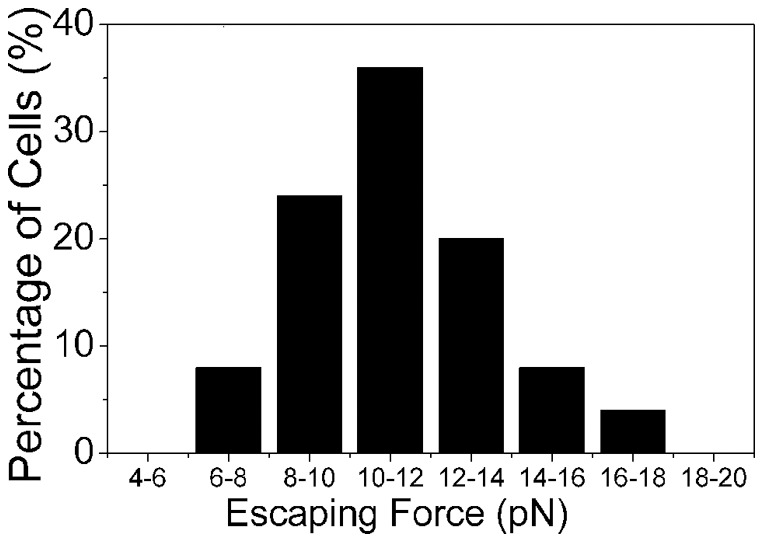
Figure 9. Histogram depicting the lower limit of the force required to separate two adhered neural progenitor cells.

This corresponds to the force required by a cell to escape from the flow cell of the optical trap schematically depicted in Fig 1B and 1C. Data presented pertains to measurements made on 56 cells.
