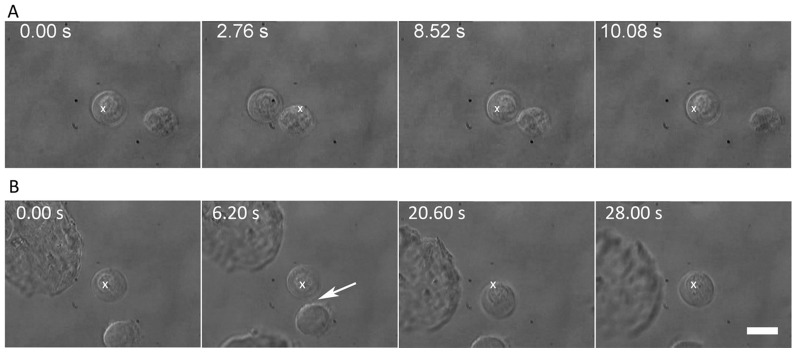
Figure 12. Time-lapse images from real-time movies depicting the outcome of a 1-hour treatment of NSCs with EGTA, a calcium ion chelator.
A) absence of membrane-mediated adhesion between the two EGTA-treated NSCs brought into close contact for ∼6 s (data extracted from Movie S6); B) filopodial contact between the two EGTA-treated NSCs results in adhesion at ∼5 s. Subsequently, the NSCs remain adhered when the trap focus is moved slightly, but they are eventually pulled apart ∼8 s later. The scale bar denotes 10 µm.

