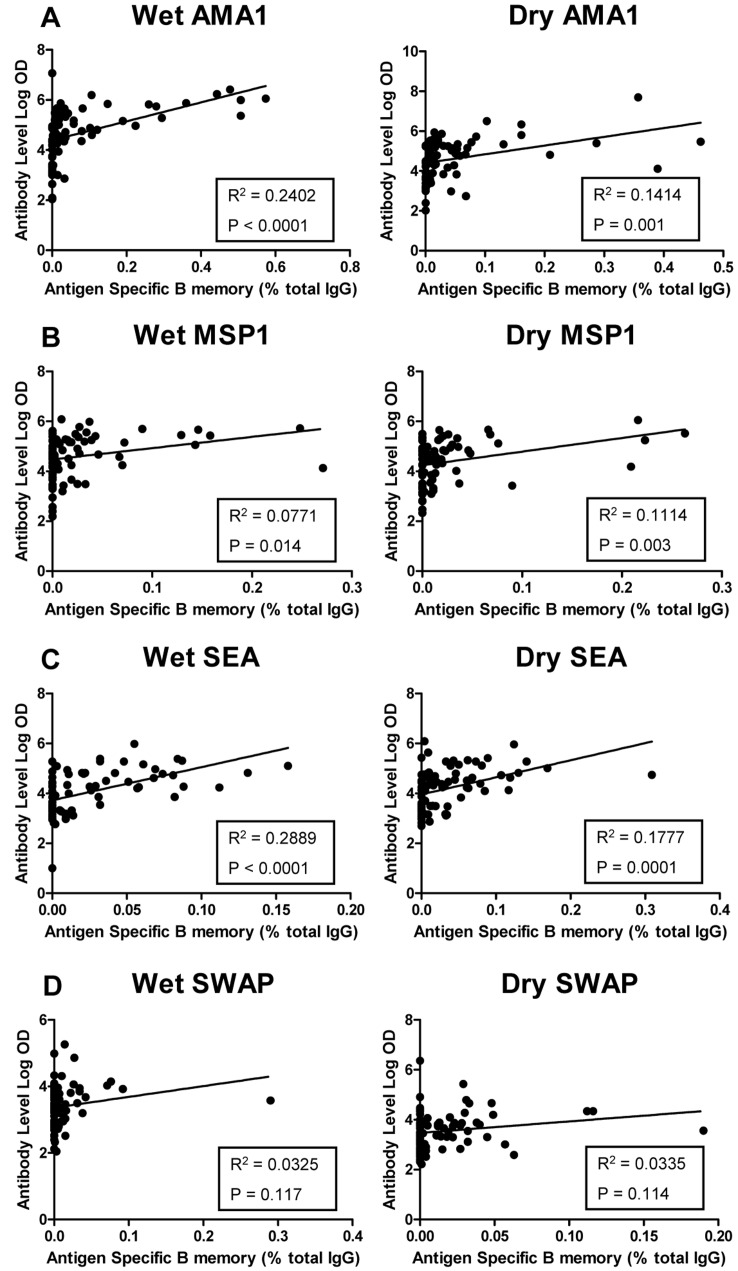
Figure 3. Correlation of antibody to B cell memory responses to P. falciparum and S. haematobium antigens.
A–D show linear regression models demonstrating correlation between log-transformed antibody titers against P. falciparum antigens (AMA1 and MSP1) and S. haematobium antigens (SEA and SWAP) compared to antigen specific B memory during the malaria transmission (wet) and subsequent dry season. Each dot represents one individual. The solid line represents the best fit regression lines with R2 calculation and P value depicted.

