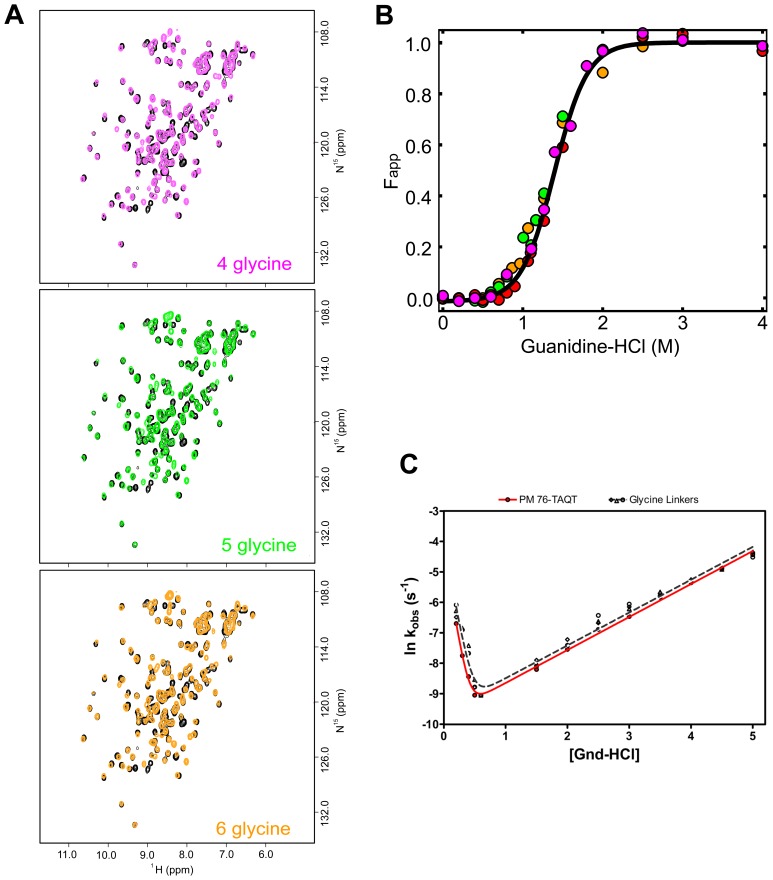
Figure 5. Plots of the (A) 1H-15N-HSQC spectra, (B) equilibrium titration and (C) chevron plot showing similar tertiary structure and no variation in equilibrium stability, cooperativity, or folding kinetics due to linker size or composition.
(A) These representative spectra were acquired to determine the effects of linker length and composition on the global fold of the protein. Each linker variant spectrum is overlaid with the spectrum of WT IL-1β (black). (Top) The spectrum of the linker variant of PM76 with 4-glycine (4G) replacing TAQT overlaid in magenta. (Middle) The spectrum of the 5-glycine linker variant (5G) overlaid in green. (Bottom) The spectrum of the 6-glycine linker variant (6G) overlaid in orange. The overall pattern remains unaffected by the linker variations. (B) An overlay of linker variants equilibrium denaturation curves PM76 with the TAQT linker (red), 4G (magenta), 5G (green) and 6G (orange) plotted as Fapp versus denaturation concentration. The continuous line representing the best-fit curve is fit to a two-state model is shown in black. (C) A chevron plot of the relaxation rates obtained by both stopped-flow and manual mixing refolding and unfolding experiments indicating the similarities in linker variants. The observed rates of PM76 with the biologically active TAQT linker (black data points) and 4G, 5G, and 6G (open data points) linker variants are plotted together.

