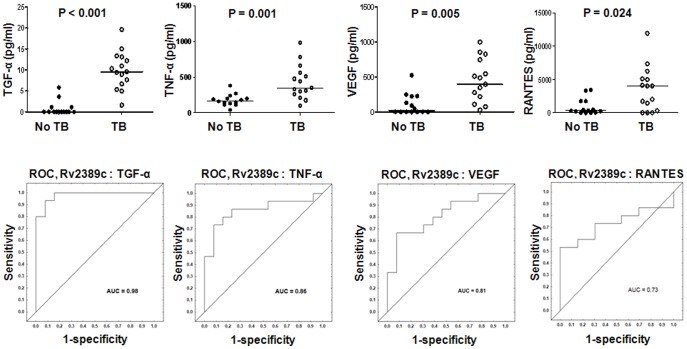
Figure 2. Host markers detected in Rv2389c stimulated whole blood cell cultures of TB and no-TB cases and receiver operating characteristics (ROC) plots showing the accuracies of these markers in discriminating between TB disease and no-TB.
Representative plots for analytes that discriminated between TB and no-TB disease with AUC ≥0.70, are shown. Error bars in the scatter plots represent the median analyte levels. AUC = Area under the ROC curve.

