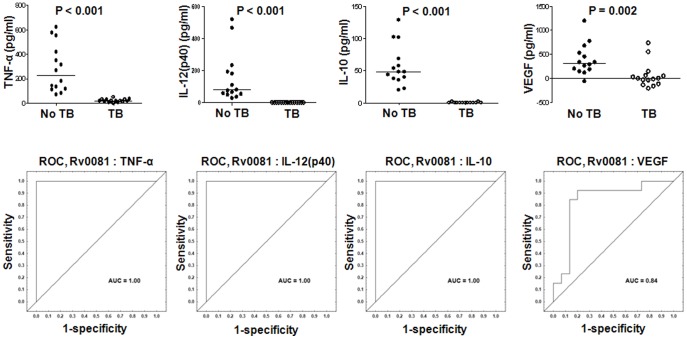
Figure 3. Host markers detected in Rv0081-stimulated whole blood cell cultures of TB and no-TB cases and receiver operating characteristics (ROC) plots showing the accuracies of these markers in discriminating between TB disease and no-TB.
Representative plots for the most potentially useful analytes are shown. The unstimulated control levels of the markers with negative responses were higher than the analyte levels detected in Rv0081 stimulated culture supernatants. Error bars in the scatter plots represent the median analyte levels. AUC = Area under the ROC curve.

