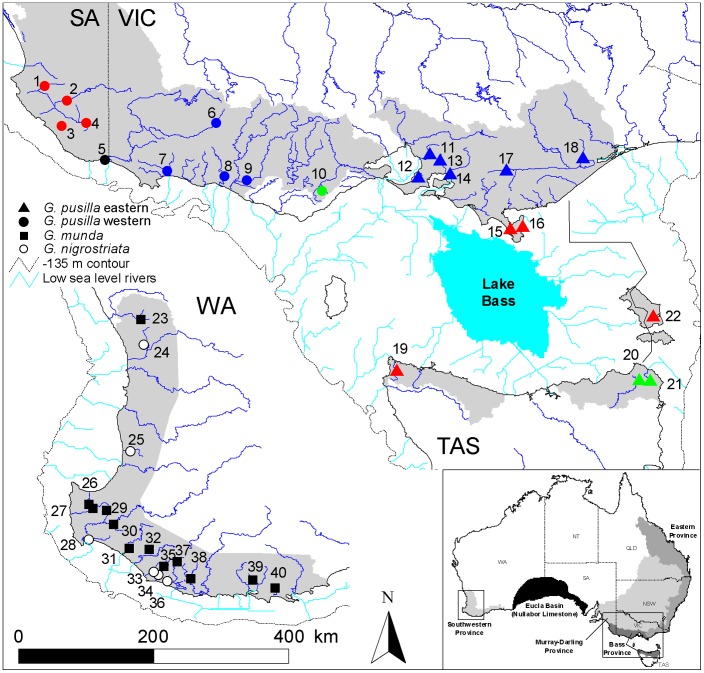
Figure 1. Localities for all Galaxiella samples examined.
Refer to Table 1 for corresponding locality details. Each species is represented by a different symbol, with populations from both lineages of G. pusilla color coded to match Figs. 2, 3 and 5. Shaded areas refer to the general distribution of each Galaxiella species. Low sea level drainage patterns are shown to the minus 135 m bathymetric contour. Bathymetry predicts a large depression that we refer to as Lake Bass. The small inset of Australia shows the relevant biogeographic provinces, and the black central southern region represents the extent of the Eucla Basin.

