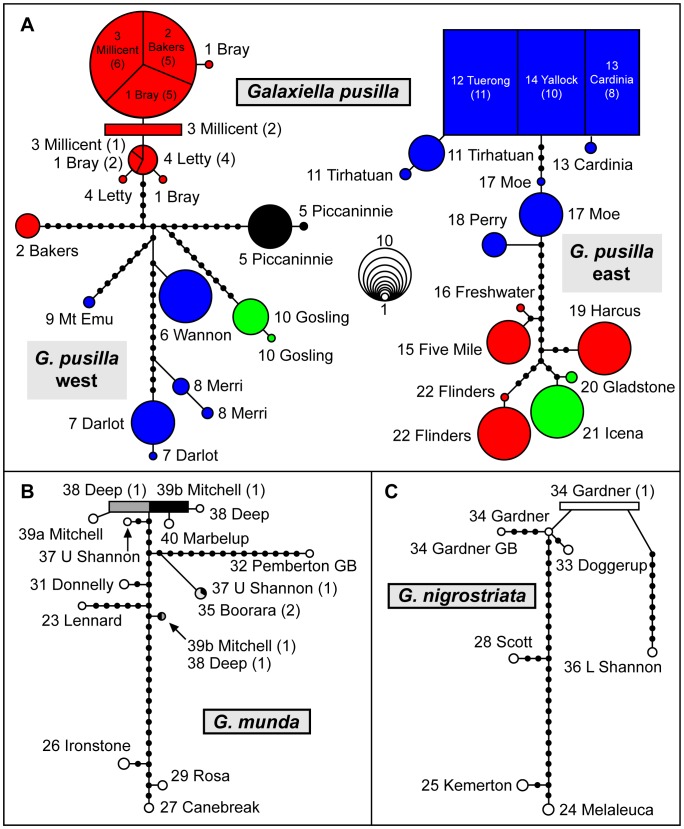
Figure 3. Haplotype networks for each Galaxiella species examined based on the cytochrome b gene.
Each haplotype within G. pusilla (A) is color-coded relative to Figs. 1, 2 and 5. Circle size represents haplotype abundance; the key to circle size is in the center of panel A. The ancestral haplotype in each network is indicated by a box. Haplotype counts are given in parentheses when multiple populations share the same haplotype. Haplotype labels consist of the population number and name from Table 1 and Fig. 1. Unsampled haplotypes are represented by small filled circles.

